What are Performance Metrics Cards?
Performance Metrics Cards (also called "Totals Row") provide an at-a-glance summary of your most important business metrics directly on the Dashboard. These KPI cards display real-time counts and monetary values for key activities, giving you instant visibility into daily, weekly, monthly, or yearly performance without running detailed reports.
Available in both agent-level and agency-level versions, these cards automatically update as transactions occur, ensuring you always see current data for informed decision-making.
How to Access Performance Metrics Cards
Performance Metrics Cards appear as widgets on your Dashboard:
- Navigate to your Dashboard (home icon in top navigation)
- If not already added, click your Profile icon → Select Dashboard Designer
- Drag the Agent Totals Row or Agency Totals Row widget to your Dashboard layout
- Click Save to apply changes
Agent-Level vs. Agency-Level Perspectives
The Performance Metrics Cards widget comes in two versions to serve different organizational roles:
Agent Totals Row
Who sees this: Individual agents tracking their personal performance
What it shows: Metrics for policies and transactions created or handled by the logged-in agent only
Use case: Agents use this to monitor progress toward personal sales goals, track commission earnings, and measure daily productivity
Agency Totals Row

Who sees this: Managers, administrators, and agency owners
What it shows: Aggregated metrics across all agents in the agency (or office, depending on permissions)
Use case: Managers use this to monitor overall team performance, identify trends, and make strategic business decisions
Metrics Displayed on Performance Cards
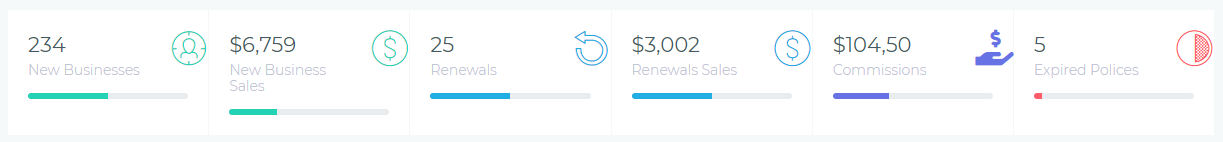
Both Agent and Agency Totals Row widgets display the same six metrics, with values reflecting either individual or aggregated performance:
New Businesses
Count
- What it tracks: Number of new policies created (not renewals or endorsements)
- Display color: Green icon (Target Market icon)
- Why it matters: Measures new customer acquisition and sales activity
New Business Sales
Total Amount
- What it tracks: Total premium value of new business policies
- Display color: Green icon (Dollar Sign icon)
- Why it matters: Measures revenue from new customer acquisition
Renewals
Count
- What it tracks: Number of policies renewed during the selected period
- Display color: Blue icon (Repeat icon)
- Why it matters: Indicates customer retention rate and book of business stability
Renewal Sales
Total Amount
- What it tracks: Total premium value of renewals
- Display color: Blue icon (Dollar Sign icon)
- Why it matters: Measures recurring revenue from existing customers
Commissions
Total Amount
- What it tracks: Total commission income from all policies (new business, renewals, endorsements)
- Display color: Purple icon (Hand Holding USD icon)
- Why it matters: Direct measure of income and compensation performance
Expired Policies
Count
- What it tracks: Policies that expired during the selected period without renewal
- Display color: Red icon (Contrast icon)
- Why it matters: Identifies retention problems and lost revenue opportunities
Using the Period Selector
Performance Metrics Cards include a period selector dropdown that lets you change the time frame for displayed data:
- This Week – Sunday through Saturday of the current week
- This Month – First day through last day of the current calendar month
- This Quarter – Current fiscal quarter (Q1: Jan-Mar, Q2: Apr-Jun, Q3: Jul-Sep, Q4: Oct-Dec)
- Year to Date (YTD) – January 1st through today
- Last 30 Days – Rolling 30-day window from today backward
- Last 90 Days – Rolling 90-day window from today backward
- Last Year – Previous calendar year (Jan 1 - Dec 31 of last year)
The selected period applies to all metrics on the card. For example, selecting "This Month" shows new businesses, renewals, commissions, and expired policies for the current month only.
Interpreting the Data
What Good Performance Looks Like
- Growing New Businesses: Consistent or increasing new business count indicates healthy lead conversion and sales activity
- High Renewal Rate: Renewal count approaching or exceeding new business count shows strong customer retention
- Rising Commissions: Commission earnings growing month-over-month reflects effective sales and policy management
- Low Expired Policies: Minimal expired policy count suggests strong renewal processes and customer satisfaction
Red Flags to Watch For
- Declining New Businesses: Decreasing new business count may indicate lead quality issues, market changes, or sales process problems
- Low Renewals: Renewal count significantly below new business suggests retention problems or upcoming book of business erosion
- Flat Commissions Despite Sales Growth: Commission earnings not matching policy growth may indicate product mix shift to lower-commission products
- High Expired Policies: Rising expired policy count signals retention problems, poor renewal processes, or customer dissatisfaction
Common Use Cases
Daily Performance Check (Agents)
Start your day by checking the Agent Totals Row set to "This Week" to see:
- How many policies you've written this week
- Week-to-date commission earnings
- Progress toward weekly sales goals
Monthly Performance Review (Managers)
At month-end, review the Agency Totals Row set to "This Month" to:
- Assess overall team performance against targets
- Identify top performers for recognition
- Calculate monthly revenue and commission expenses
- Plan next month's strategies based on trends
Quarterly Business Planning (Agency Owners)
Use "This Quarter" and "Last Year" comparisons to:
- Evaluate quarter-over-quarter growth
- Identify seasonal patterns in new business and renewals
- Assess commission trends and adjust resource allocation
- Set realistic targets for the next quarter
Year-End Analysis
Set the period to "Year to Date" to:
- Calculate annual commission income for tax purposes
- Measure year-over-year growth by comparing to "Last Year"
- Evaluate annual retention rate (renewals vs. new businesses)
- Identify trends for strategic planning
Tips for Maximizing Value
- Set Personal Benchmarks: Agents should track their average weekly metrics and aim to meet or exceed them consistently
- Compare Agent vs. Agency: Managers can add both Agent and Agency Totals Row widgets to see personal performance alongside team performance
- Monitor Daily During Peak Seasons: Check metrics more frequently during busy periods (tax season, open enrollment) to ensure targets are met
- Use with Reports for Deep Dives: When metrics show unexpected changes, drill down using detailed reports to identify root causes
- Share Wins with the Team: Managers can screenshot the Agency Totals Row during team meetings to celebrate milestones
- Track Expired Policy Trends: Rising expired policies may indicate retention issues—investigate and address promptly
Troubleshooting
Metrics Show Zero or Incorrect Values
- Check Period Selection: Ensure the period selector is set to the correct time frame (not accidentally set to "Last Year")
- Verify Permissions: Agency-level widgets require proper permissions—contact your administrator if you believe you should see team data
- Confirm Data Entry: Policies must have effective dates within the selected period to appear in counts
- Refresh Dashboard: Navigate away and return to the Dashboard to trigger a data refresh
Widget Not Available in Dashboard Designer
- Role Restrictions: Your user role may not have permission to access Totals Row widgets—contact your administrator
- Office Restrictions: Some agencies restrict certain widgets by office—verify your office permissions
Metrics Don't Match Reports
- Date Range Differences: Dashboard widgets use policy effective dates; some reports use creation dates—verify date logic
- Filtered Reports: Reports may have filters applied (office, carrier, product) that Dashboard widgets don't use
- Timing: Reports may be cached or generated at specific times; Dashboard metrics are real-time
Need Help?
If you have questions about Performance Metrics Cards or need assistance interpreting your data, look for the Newton AI magic button (purple sparkle icon) in the bottom-right corner. Newton can explain what each metric means, help you identify trends, and suggest actions based on your Dashboard data.