Goals Summary widgets help you track monthly sales performance against your targets using color-coded donut gauges. These widgets answer the question: "Am I on track to hit my goals this month?" Available in My Goals Summary (Agent view) and Agency Goals Summary (Agency-wide view).
What This Widget Shows
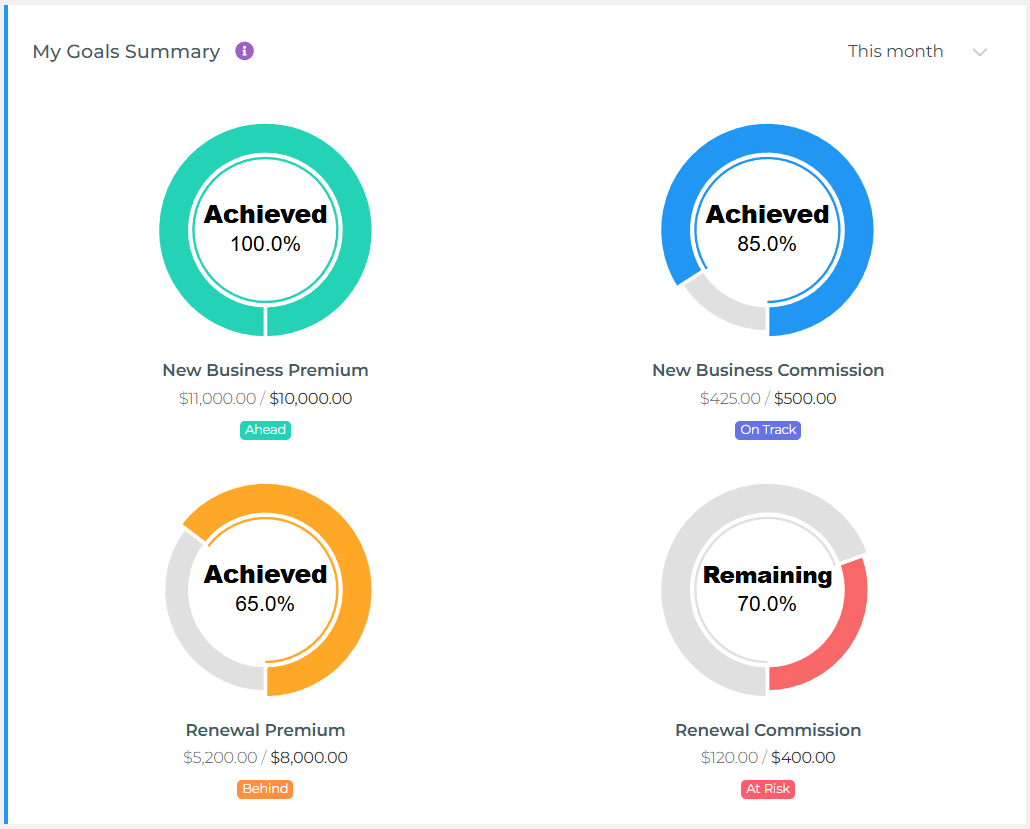
This is a Monthly Goal Tracker—it displays your progress toward four different sales goals using visual donut gauges with status indicators:
- New Business Premium Goal: Target amount of premium from new policies
- New Business Commission Goal: Target commission earned from new policies
- Renewal Premium Goal: Target amount of premium from renewed policies
- Renewal Commission Goal: Target commission earned from renewals
Understanding the Status Indicators
Each goal gauge displays one of four color-coded status badges:
Ahead (Green Badge)
You've exceeded your goal for the selected period.
What it means: "I'm ahead of my target—I've already surpassed what I set out to achieve."
Example (This Month view): Your NB Premium goal is $10,000/month. You've sold $11,200 in NB Premium this month—you're $1,200 ahead → Ahead
On Track (Blue Badge)
You're within 10% of your goal (above or below).
What it means: "I'm close to my target—within acceptable range."
Example (This Month view): Your monthly goal is $10,000. You've sold $9,200—that's 92% of target (within 10% tolerance) → On Track
Behind (Orange Badge)
You're more than 10% below your goal but have made some progress.
What it means: "I need to accelerate—I'm falling short of my target."
Example (This Month view): Your monthly goal is $10,000. You've sold $6,500—that's 65% of target (more than 10% short) → Behind
At Risk (Red Badge)
You have zero progress toward this goal—no sales activity in this category for the selected period.
What it means: "I haven't started working on this goal yet—immediate action needed."
Example: Your monthly goal is $10,000. You've sold $0 in this category this month → At Risk
How the Donut Gauges Work
Each donut gauge visualizes your progress:
- Center Number: Your actual achievement (dollars or count) for the period so far
- Filled Arc: Visual representation of progress toward your goal
- Status Badge: Color-coded indicator (Ahead/On Track/Behind/At Risk)
- "Goal: $X" Label: Your target for the selected period
Agent vs Agency Views
My Goals Summary (Agent View)
- Shows: Only YOUR personal monthly goals and your actual performance
- Who uses it: Individual agents tracking their own monthly targets
- Use case: "Am I on pace to hit my personal goals this month?"
- Goal source: Goals set in your Profile page under Personal Goals section
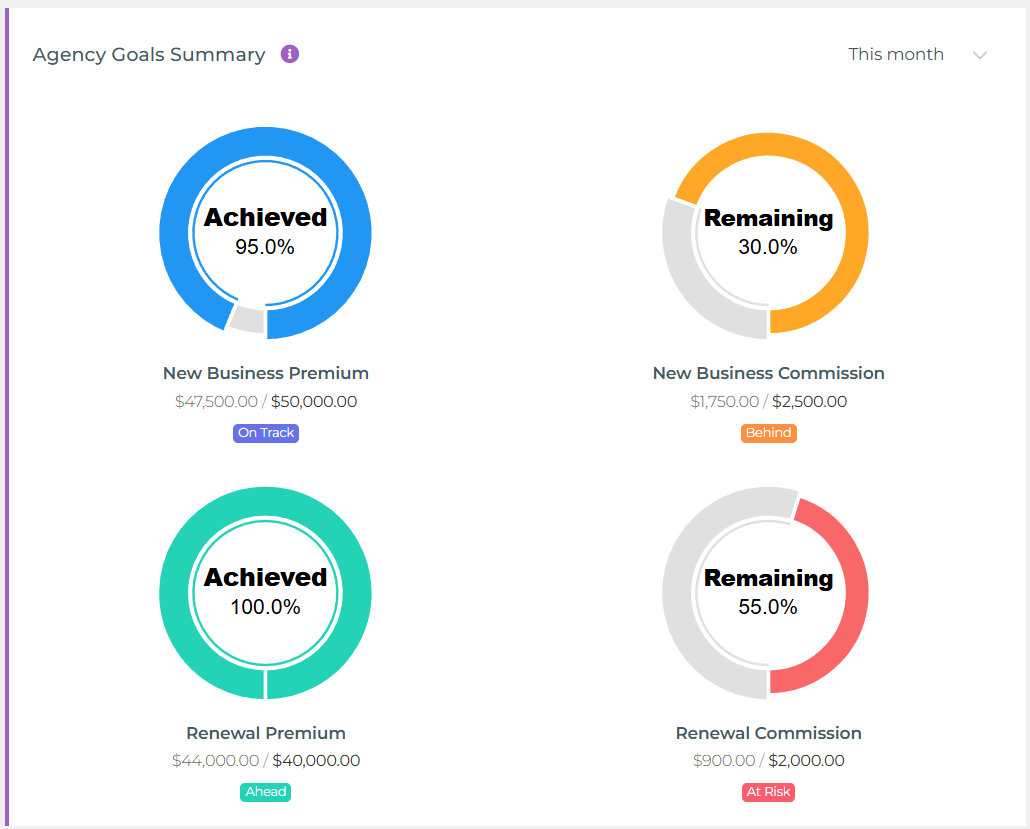
Agency Goals Summary (Agency View)
- Shows: Agency-wide monthly goals aggregated across ALL agents
- Who uses it: Agency owners, managers, users with agency-level permissions
- Use case: "Is the team on track to hit our monthly agency targets?"
- Goal source: Agency goals set by administrators in Agency Settings
Using the Widget Controls
Period Selector (Dropdown)
Choose your time range:
- This Week: Shows progress toward weekly target (monthly goal ÷ 4)
- This Month (Default): Shows progress toward your full monthly goal
- This Quarter: Shows progress toward quarterly target (sum of 3 monthly goals)
- Year to Date: Shows progress toward year-to-date target (sum of monthly goals from January to current month)
Common Use Cases
1. Daily Performance Check-In
Question: "Where do I stand on my monthly goals right now?"
How to use:
- Check the widget first thing each morning
- Identify which goals show "Behind" or "At Risk" status
- Prioritize activities that move those metrics forward
- Celebrate "Ahead" and "On Track" categories to maintain momentum
2. Mid-Month Course Correction
Question: "Am I falling behind? Do I need to adjust my strategy?"
How to use:
- On the 15th, review all four gauges
- If multiple categories show "Behind," consider increasing activity levels
- If renewals are "At Risk," prioritize follow-up calls with expiring policies
- If new business is "Behind," focus on pipeline conversion activities
3. Team Performance Monitoring (Agency View)
Question: "Is the team on track collectively? Where do we need support?"
How to use:
- Review the Agency Goals Summary daily
- Identify team-wide shortfalls (e.g., renewals "Behind" across the board)
- Implement targeted coaching or campaigns to address weak areas
- Compare agency performance to individual agent metrics to spot outliers
4. End-of-Month Forecasting
Question: "Will I hit my goals by month-end? What's my projected shortfall?"
How to use:
- On day 25, check your status across all four goals
- Calculate the gap: (Full monthly goal × remaining days ÷ total days) - current achievement
- Example: $10k goal, day 25 of 30, achieved $7k → Need $3k more, but prorated target is $8.3k → You're $1.3k behind pace
- Focus remaining days on closing the largest gaps
Understanding the Numbers
What Gets Counted?
New Business Premium & Commission:
- New policies issued during the selected period
- Based on policy effective date (not creation date)
- Includes all new business transaction types
Renewal Premium & Commission:
- Renewed policies during the selected period
- Based on renewal effective date
- Includes all renewal transaction types
When Data Updates
Goals data refreshes overnight—today's sales will appear in tomorrow's widget. Your status badges are calculated each time you view the widget based on your current achievement compared to your goal for the selected period.
Setting Your Goals
Troubleshooting Common Issues
Widget Shows "At Risk" for All Goals
Cause: No goals have been set for this period.
Solution:
- Agent View: Go to My Profile → Sales Goals and set your monthly targets (if not locked by manager). If your goals are locked, contact your manager to update them.
- Agency View: Ask your administrator to set agency-wide goals in My Profile → Sales Goals → Agency Goals section
Status Seems Wrong (Shows "Behind" But Numbers Look Good)
Cause: Remember, for "This Month" view, status reflects progress against your full monthly goal, not a prorated target.
Example: If your monthly goal is $10,000 and you've achieved $6,000 by mid-month, you're at 60% of goal—which shows as "Behind" because you haven't reached the full $10,000 yet (you're more than 10% short of the target).
Numbers Don't Match Reports
Possible reasons:
- Date Range Differences: Dashboard uses policy effective dates; some reports use creation dates
- Data Lag: Dashboard updates overnight; reports may show real-time data
- Filtered Reports: Reports may have filters (office, carrier, product) that Dashboard doesn't apply
Period Selector Doesn't Change Data
Cause: You may not have goals set for other periods (weekly, quarterly).
Solution: The widget only displays meaningful data for periods where goals are configured. Most users keep the default "This Month" setting.
Best Practices
For Individual Agents:
- Set Realistic Goals: Base monthly targets on historical performance + stretch (10-20% growth)
- Daily Check-Ins: Review your Goals Summary every morning to maintain focus
- Balance Your Portfolio: Don't neglect renewals while chasing new business (or vice versa)
- Mid-Month Review: On the 15th, assess which categories need urgent attention
- Document Progress: When you hit "Ahead" status, note what activities drove success
For Agency Managers:
- Set Team Goals Collaboratively: Involve agents in setting realistic targets
- Monitor Trends: Watch for team-wide patterns (e.g., all agents "Behind" on renewals)
- Coaching Opportunities: Use "Behind" and "At Risk" statuses to trigger coaching sessions
- Celebrate Wins: Recognize agents with "Ahead" status publicly
- Adjust When Needed: If external factors change (market conditions), update goals accordingly
Related Widgets for Deeper Insights
Goals Summary widgets work best when combined with other dashboard widgets for comprehensive performance insights. Consider adding:
- Performance Metrics Cards: See detailed breakdowns of premium, commissions, and policy counts
- Sales Volume Charts: Visualize your new business vs renewal trends over time
- Commission Earnings Charts: Track how commission dollars accumulate throughout the month
- Pipeline Tracking: Monitor whether your prospects are converting at expected values