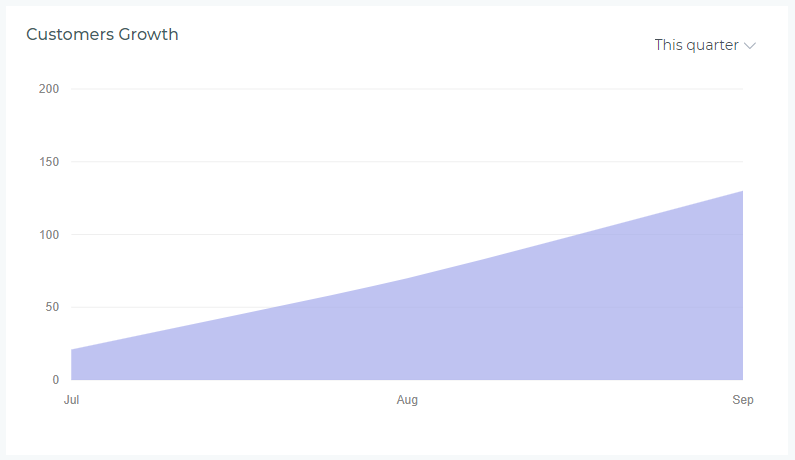
The Customer Growth widget visualizes how your customer base expands over time, tracking new customer acquisition trends month by month. This line chart helps managers understand growth patterns, measure marketing effectiveness, and forecast future capacity needs. Available only for agency-level dashboards, this widget provides insights into overall business development.
What the Widget Shows
Visual Elements
- Line Chart: Displays customer count over time with a smooth trend line
- Horizontal Axis (X-Axis): Time periods (months, weeks, or days depending on selection)
- Vertical Axis (Y-Axis): Total number of customers at each point in time
- Data Points: Circles marking the exact customer count at each interval
- Trend Line: Connects data points to show growth trajectory
- Color Legend: Below chart identifies what the line represents
What Counts as a Customer
The widget tracks unique customers in your system:
- Included: All active customers with at least one policy
- Included: Customers with expired policies (still count as part of your base)
- Included: Customers added during the selected period
- Cumulative Count: Shows total customers up to each point, not just new additions
- Agency-Wide: Combines customers across all offices and agents
Period Selector
Use the dropdown in the upper-right corner to adjust the timeframe and visualization detail:
Available Periods
- This Week: Daily customer counts for Monday through Sunday of current week
- This Month: Daily customer counts for the current calendar month (month-to-date)
- This Quarter: Monthly customer counts for current quarter (Q1, Q2, Q3, or Q4)
- This Year: Monthly customer counts for the current calendar year (year-to-date)
- Year to Date: Monthly customer counts from January 1st through today
- Last Year: Monthly customer counts for the complete previous calendar year
Shorter periods (This Week, This Month) show daily granularity, while longer periods (This Quarter, This Year, Last Year) show monthly aggregations for clearer trend visualization. The chart updates immediately when you change the period—no page refresh needed.
Reading the Chart
Understanding Growth Patterns
- Upward Slope: Customer base is growing—positive trend
- Steeper Slope: Faster growth rate—strong acquisition period
- Flat Line: Customer count holding steady—no net growth or decline
- Slight Upward Curve: Accelerating growth—momentum building
- Plateau After Growth: Growth has leveled off—may need renewed marketing efforts
Identifying Key Insights
- Seasonal Patterns: Recurring spikes or dips at specific times (e.g., tax season, policy renewal periods)
- Marketing Impact: Growth spikes following campaigns or promotions
- Consistent Growth: Steady upward trend indicates sustainable acquisition strategy
- Growth Gaps: Flat periods may indicate need for outreach or lead generation
- Year-Over-Year Comparison: Compare This Year vs Last Year to measure improvement
Common Use Cases
Business Planning and Forecasting
Use customer growth trends to:
- Forecast future customer base size for capacity planning
- Estimate staffing needs based on growth trajectory
- Project revenue potential from expanding customer base
- Set realistic acquisition goals for upcoming quarters
- Plan office expansion or territory assignments
Marketing Effectiveness
Measure marketing impact:
- Track customer growth before and after marketing campaigns
- Identify which time periods yielded best acquisition results
- Measure ROI of advertising spend through growth correlation
- Compare growth during different promotional strategies
- Justify marketing budget increases with demonstrated growth
Agent Performance and Territory Analysis
While this is an agency-level widget, insights help:
- Understand overall market penetration and saturation
- Identify if certain periods are better for prospecting
- Set benchmarks for agent acquisition targets
- Recognize when agency-wide initiatives are working
- Coordinate team efforts around high-growth periods
Strategic Decision Making
Inform major business decisions:
- Determine if current growth rate supports expansion plans
- Assess whether to invest in additional carriers or products
- Evaluate need for technology upgrades to handle volume
- Decide when to hire additional agents or support staff
- Identify market opportunities based on growth patterns
What This Widget Doesn't Show
Other Limitations
- No Agent Breakdown: Shows agency total only—doesn't attribute customers to specific agents
- No Office Segmentation: Combines all offices—can't isolate individual locations
- No Customer Type Filter: Doesn't separate personal vs commercial customers
- No Revenue Information: Tracks customer count, not value or premium volume
- No Retention Visibility: Doesn't show how many existing customers remain active
For more granular analysis, use the comprehensive customer reports available in the Reporting section, which provide breakdowns by agent, office, customer type, and retention metrics.
Interpreting Different Growth Scenarios
Scenario 1: Steady Linear Growth
What it looks like: Consistent upward slope at roughly the same angle
What it means: Your agency is acquiring customers at a predictable, sustainable rate. Marketing and sales efforts are consistent and reliable.
Action: Maintain current strategies while exploring opportunities to accelerate growth without sacrificing quality.
Scenario 2: Accelerating Growth (Upward Curve)
What it looks like: Line curves upward with increasing steepness
What it means: Your customer acquisition rate is increasing—each period brings more new customers than the last. Strong momentum and market demand.
Action: Capitalize on momentum by increasing marketing investment and ensuring operational capacity can handle continued acceleration.
Scenario 3: Plateau After Growth
What it looks like: Steep upward slope followed by flat or minimal growth
What it means: Initial growth spurt (perhaps from a campaign or new market entry) has leveled off. May indicate market saturation or decreased marketing activity.
Action: Investigate causes—was it a temporary campaign effect? Need new marketing strategies? Explore new customer segments or products.
Scenario 4: Seasonal Spikes and Valleys
What it looks like: Repeating pattern of growth and slowdown at predictable intervals
What it means: Your business follows predictable seasonal patterns (e.g., tax season for certain insurance types, back-to-school, year-end).
Action: Plan staffing and marketing around known high-acquisition periods. Develop strategies to smooth out valleys and maintain growth year-round.
Scenario 5: Flat Line (No Growth)
What it looks like: Horizontal line with little to no upward movement
What it means: Customer base is stagnant—either no new acquisitions, or new customers are balanced by losses. Potential concern for business sustainability.
Action: Urgent review needed—increase marketing efforts, review lead generation processes, assess competitive pressures, and examine customer retention issues.
Combining with Other Metrics
For complete business intelligence, use Customer Growth alongside:
- Sales Volume Charts: See if new customers are writing policies at expected rates
- Commission Earnings: Verify that customer growth translates to revenue growth
- Performance Cards: Check if new business and renewal counts align with customer growth
- Retention Reports: Understand how many existing customers you're keeping vs acquiring
- Revenue Per Customer: Available in reports—shows if growth is profitable or diluting value
Troubleshooting and FAQs
Why does the chart show growth even when we're not adding many new policies?
The widget tracks unique customers, not policies. If existing customers are adding additional policies (e.g., bundling home + auto), or if you're writing policies for customers already in the system from prior periods, the customer count won't change. Customer growth only increases when completely new customers (never in your system before) are added.
Can I see customer growth by agent or office?
This dashboard widget shows agency-level totals only. For breakdowns by agent, office, or other dimensions, use the detailed customer acquisition reports in the Reporting section, which offer filtering and segmentation options.
Why does my growth look flat even though we're working hard?
A flat trend could mean: (1) New customer additions are offset by customer departures (check retention reports), (2) You're writing more policies for existing customers rather than acquiring new ones, or (3) There's a data lag if customers are entered in batches. Review your customer entry processes and retention metrics.
How often does the chart update?
The chart reflects data as of the last dashboard refresh. New customers added to the system appear immediately on next refresh. There's no delay—if you add a customer today, they'll be counted in today's data point.
Does the chart account for customers who leave?
No, this is a cumulative count of all customers ever added to your system during the period. It doesn't subtract customers who cancel all policies or become inactive. For net customer counts (active customers only), use customer status reports in the Reporting section.
Best Practices
- Review Monthly: Track trends at least once per month to catch changes early
- Compare Year-Over-Year: Use "Last Year" period to benchmark current performance
- Set Growth Targets: Based on historical trends, establish realistic acquisition goals
- Investigate Anomalies: Sudden spikes or drops warrant immediate investigation
- Correlate with Marketing: Track campaign dates against growth patterns to measure effectiveness
- Share with Team: Use growth trends in meetings to motivate and align efforts
- Plan for Capacity: Use growth projections to ensure adequate staffing and resources
- Balance Quality and Quantity: Growth is good, but ensure new customers are profitable and well-served