Commission Earnings Charts provide visual analysis of your commission income trends, helping you track earnings patterns, forecast income, and identify your most profitable periods. These charts break down commission earnings by source (new business vs. renewals) and are available in two perspectives: My Commissions (Agent view) and Agency Commissions (Agency-wide view).
Agent vs Agency Perspectives
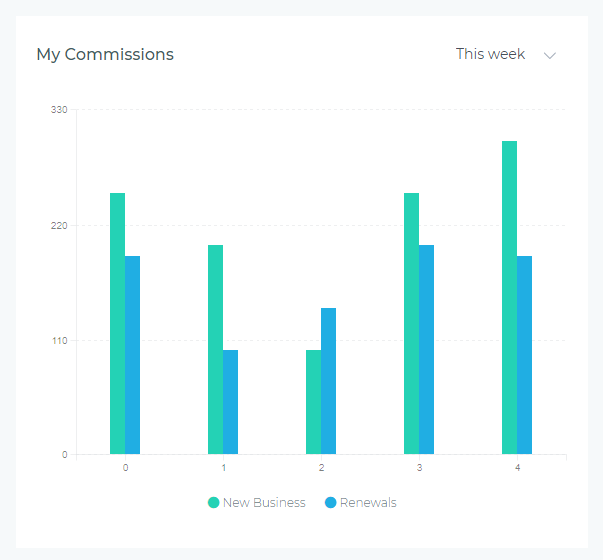
My Commissions Chart (Agent View)
Displays only your personal commission earnings—commissions from policies you created, renewed, or service.
- Who sees it: Individual agents tracking their own commission income
- What it shows: Your commission earnings from new business and renewals over the selected period
- Use case: Personal income tracking, tax planning, identifying most profitable activities
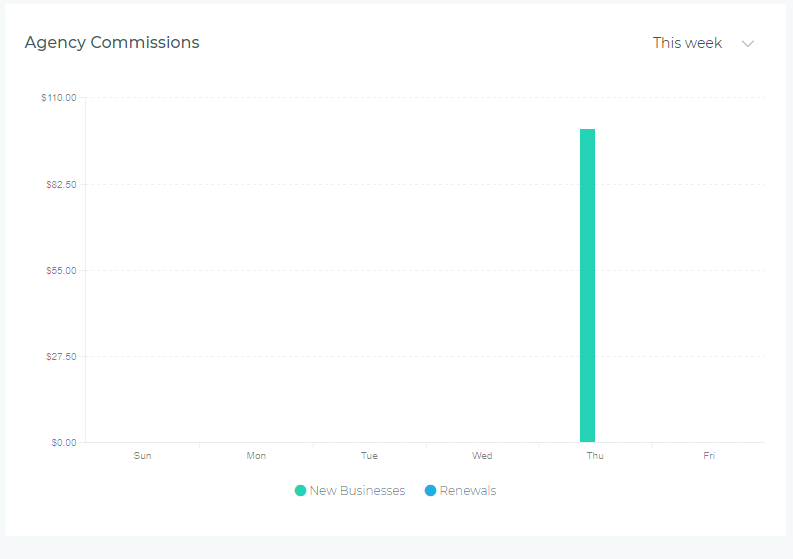
Agency Commissions Chart (Agency View)
Displays aggregate commission earnings across all agents—total agency commission income from all policies.
- Who sees it: Agency owners, managers, and users with agency-level permissions
- What it shows: Total agency commission earnings from new business and renewals over the selected period
- Use case: Agency revenue tracking, compensation planning, profitability analysis
Understanding the Chart
Visual Elements
- Green Area: Commission earnings from New Businesses (first-time policies or new products)
- Blue Area: Commission earnings from Renewals (existing policies renewed during period)
- X-Axis: Time intervals based on selected period (days, weeks, months, quarters)
- Y-Axis: Commission dollar amount
Reading the Data
The chart uses stacked areas, meaning:
- The green area shows new business commission earnings at the bottom
- The blue area stacks on top, showing renewal commission earnings
- The total height at any point represents combined commission income (new + renewals)
- Peaks indicate high-earning periods; valleys show lower income periods
- Area proportions show which activity type (new business vs. renewals) drives most income
Period Selector
The dropdown in the upper-right corner lets you adjust the time range displayed:
- This Week: Daily commission data for the current week (Monday-Sunday)
- This Month: Daily commission data for the current calendar month
- This Quarter: Weekly commission data for the current quarter (Q1, Q2, Q3, Q4)
- This Year: Monthly commission data for the current calendar year (January-December)
- Year to Date: Monthly commission data from January 1st through today
- Last Year: Monthly commission data for the previous calendar year
Data updates instantly when you change the period—no page refresh needed.
Common Use Cases
Personal Income Tracking (Agents)
Use "This Month" view to:
- Monitor month-to-date commission earnings vs. income goals
- Identify which days generated the most commission (peak earning days)
- Compare new business commissions vs. renewal commissions
- Adjust sales focus based on commission potential (higher commission products or activities)
Tax Planning and Forecasting
Use "Year to Date" view to:
- Calculate total commission income for quarterly estimated tax payments
- Track year-over-year commission growth by comparing to "Last Year"
- Identify months with highest earnings for expense timing (deductible business expenses)
- Project annual income based on current pace
Compensation Planning (Managers)
Use Agency Commissions Chart with "This Quarter" to:
- Assess agency profitability and cash flow for compensation budgeting
- Determine bonus pool availability based on total commission earnings
- Identify high-earning quarters for strategic hiring or expansion
- Compare commission earnings to expenses for financial health analysis
Identifying Revenue Drivers
Analyze the green vs. blue area proportions:
- Mostly Green (New Business): Commission income driven by new customer acquisition—growth phase, potentially higher effort
- Mostly Blue (Renewals): Commission income from existing book of business—stable recurring income, less prospecting effort
- Balanced Mix: Healthy blend of acquisition income and retention income—sustainable business model
- Shifting Proportions: If blue shrinks over time, renewal commissions declining—retention problem or lower renewal rates
Goal Achievement Tracking
Compare current period vs. past periods:
- Switch between "This Month" and same month last year to measure growth
- Use "This Quarter" to track progress toward quarterly commission targets
- Monitor daily trends in "This Week" to stay on pace for weekly goals
- Identify slow weeks/months early to adjust effort allocation
Interpreting Patterns
Healthy Commission Patterns
- Steady Upward Trend: Both new business and renewal commissions increasing—indicates growing income and sustainable book of business
- Consistent Renewal Commissions (Blue Stable): Recurring income from renewals remains stable—shows strong retention and reliable income stream
- Predictable Peaks: Regular high-commission periods aligned with product launches, marketing campaigns, or seasonal trends
- Proportional Mix: New business and renewal commissions roughly balanced—healthy business model with both acquisition and retention
Warning Signs
- Declining Renewals (Blue Shrinking): Renewal commission income dropping—customers not renewing, potential retention crisis
- Flat New Business (Green Plateauing): New business commissions stagnant—lead generation problems or market saturation
- Erratic Spikes: Unpredictable commission patterns—inconsistent sales activity, one-time windfalls, or workflow issues
- Total Income Declining: Combined commissions dropping consistently—immediate action needed to investigate root causes
Tips for Maximizing Value
- Check Weekly: Review "This Week" view every Monday to plan income-generating activities for the week
- Set Income Benchmarks: Calculate your average weekly/monthly commission and aim to meet or exceed consistently
- Compare Year-Over-Year: Use "This Year" vs "Last Year" views to measure commission growth annually
- Track Renewal Income: Monitor blue area size—if shrinking, prioritize customer retention and renewal conversations
- Correlate with Sales Charts: View alongside Sales Volume Charts to understand commission per policy (are you writing higher-commission products?)
- Export for Records: Screenshot chart quarterly for tax records, performance reviews, or loan applications
Troubleshooting
Chart Shows Zero or No Data
- Check Period Selection: Ensure you're viewing a period during which you earned commissions
- Verify Permissions: Agency Commissions Chart requires agency-level access—contact administrator if needed
- Commission Processing Delay: Recent commissions (today) may not appear immediately if commission calculations run nightly
Numbers Don't Match Statements
- Timing Differences: Chart shows earned commissions (policy effective date); statements show paid commissions (payment date)
- Pending Commissions: Chart may include commissions not yet paid out but earned based on issued policies
- Date Range Mismatch: Ensure chart period matches statement period exactly (statement month vs. calendar month)
- Adjustments and Chargebacks: Commission statements may include adjustments, chargebacks, or corrections not reflected in chart
Chart Loads Slowly
- Large Period: "Year to Date" or "Last Year" with high volume takes longer to calculate—be patient
- Network Speed: Chart data loads from server—slow connection increases load time
- Browser Performance: Clear browser cache if chart consistently fails to load or displays incorrectly
Best Practices
- Daily Check (Agents): Glance at "This Week" view each morning to stay aware of commission pace
- Monthly Review: End-of-month review using "This Month" to assess income goal achievement
- Quarterly Tax Planning: Use "This Quarter" to calculate estimated tax payments and adjust withholding
- Annual Income Analysis: Compare "This Year" vs "Last Year" annually to measure career growth and set next year's goals
- Revenue Source Analysis: If green (new business) dominates, ensure you're also focusing on retention to build recurring income
- Team Meetings (Managers): Display Agency Commissions Chart during meetings to celebrate team wins and visualize agency profitability
Next Steps
Commission Earnings Charts work best when combined with other dashboard widgets for comprehensive financial insights:
- Performance Metrics Cards: See exact commission dollar amounts alongside visual trends
- Sales Volume Charts: Correlate policy count with commission earnings to identify high-value products
- Expected vs Actual Charts: Compare forecasted commission income to actual earnings for accuracy