Team Performance Leaderboards provide a motivating, at-a-glance view of your top-performing agents ranked by their achievements. These widgets create healthy competition, recognize high performers, and help managers identify coaching opportunities. Two ranking types are available: by total commission earnings and by total policy count.
Two Types of Leaderboards
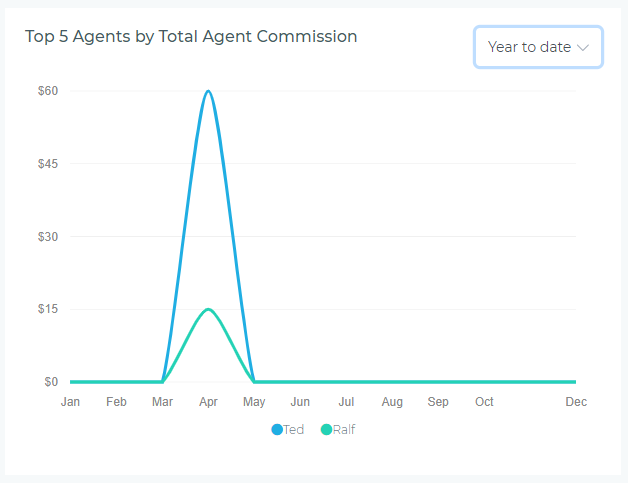
Top Five by Commission Earnings
Ranks agents by their total commission income earned during the selected period. This leaderboard highlights who's generating the most revenue for the agency.
- What it measures: Total commission dollars earned (new business + renewals + endorsements)
- Chart type: Horizontal bar chart with agent names and dollar amounts
- Who sees it: Managers and administrators with agency-level dashboard access
- Use case: Identify top earners, reward performance, understand income distribution across team
Top Five by Policy Count
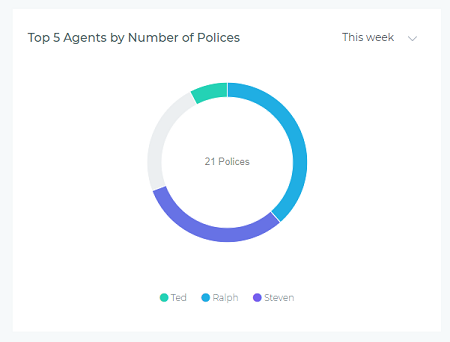
Ranks agents by the total number of policies they've written during the selected period. This leaderboard shows who's most productive in terms of volume.
- What it measures: Total count of policies issued (new business + renewals)
- Chart type: Horizontal bar chart with agent names and policy counts
- Who sees it: Managers and administrators with agency-level dashboard access
- Use case: Measure productivity, identify volume leaders, track acquisition activity
Understanding the Leaderboard Display
Visual Elements
- Horizontal Bars: Each agent represented by a colored horizontal bar
- Length of Bar: Indicates relative performance (longer = higher value)
- Agent Names: Listed on the left side of each bar
- Numeric Values: Displayed at the end of each bar (dollars or policy count)
- Color Legend: Below chart shows which color represents each agent
- Ranking Order: Top performer at the top, fifth place at the bottom
Reading the Rankings
- First Place: Longest bar at the top - highest earner or most policies
- Relative Gaps: Visual distance between bars shows performance differences
- Close Competition: Bars of similar length indicate tight races
- Significant Leads: Much longer top bar shows dominant performance
- Empty Positions: If fewer than five agents qualify, chart shows only active performers
Period Selector
The dropdown in the upper-right corner lets you adjust the ranking timeframe:
- This Week: Rankings for Monday-Sunday of current week
- This Month: Rankings for the current calendar month (month-to-date)
- This Quarter: Rankings for current quarter (Q1, Q2, Q3, or Q4)
- This Year: Rankings for the current calendar year (year-to-date)
- Year to Date: Rankings from January 1st through today
- Last Year: Rankings for the complete previous calendar year
Rankings update immediately when you change the period—no page refresh required.
Common Use Cases
Performance Recognition and Rewards
Use leaderboards to:
- Recognize top performers publicly during team meetings
- Determine monthly or quarterly bonus recipients
- Identify agents eligible for performance-based incentives
- Celebrate achievements and milestone completions
- Create agent spotlight features in internal newsletters
Healthy Competition and Motivation
Visible rankings encourage agents to:
- Strive for top positions on the leaderboard
- Improve performance to move up in rankings
- Maintain their position if already ranked
- Set personal goals based on top performer benchmarks
- Stay engaged with gamification elements
Identifying Coaching Opportunities
Managers can use leaderboards to:
- Identify agents who might need additional training or support
- Connect lower performers with top performers for mentorship
- Understand skill gaps by comparing commission vs volume rankings
- Track improvement over time by comparing different periods
- Allocate resources to help underperforming team members
Strategic Business Insights
Analyze leaderboard patterns:
- High Commission, Low Volume: Agent focuses on premium products or larger policies
- High Volume, Lower Commission: Agent excels at processing renewals or smaller policies
- Consistent Top Rankings: Reliable performers who should be retained and rewarded
- Emerging Rankings: New or improving agents showing growth potential
- Seasonal Changes: Rankings shift based on product cycles or market conditions
Privacy and Team Dynamics Considerations
Best Practices for Using Leaderboards
- Balance Recognition: Celebrate top performers while encouraging all team members
- Use Multiple Metrics: Don't focus solely on commission or volume—recognize different strengths
- Provide Context: Explain how rankings are calculated to ensure fairness perception
- Focus on Improvement: Emphasize growth and progress, not just absolute rankings
- Combine with Coaching: Use rankings as conversation starters, not performance evaluation tools
- Rotate Recognition: Acknowledge different agents for different achievements (customer satisfaction, retention, etc.)
How Rankings Are Calculated
Commission Leaderboard Calculation
- Source: All posted commissions within the selected period
- Included: New business commissions + renewal commissions + endorsement commissions
- Agent Assignment: Commission credited to the agent assigned to the policy
- Split Commissions: If commissions are split, each agent receives credit for their portion
- Ranking Tie-Breaker: If two agents have identical commission totals, alphabetical order determines position
Policy Count Leaderboard Calculation
- Source: All policies with an effective date within the selected period
- Included: New business policies + renewal policies
- Excluded: Cancelled policies, pending applications (not yet issued)
- Agent Assignment: Policy credited to the servicing agent or agent who created it
- Ranking Tie-Breaker: If two agents have identical policy counts, alphabetical order determines position
Troubleshooting and FAQs
Why do rankings show fewer than five agents?
If your agency has fewer than five active agents during the selected period, or if some agents had zero commissions/policies, the leaderboard will only display qualifying performers. This is normal for smaller agencies or shorter time periods.
Why does an agent appear on one leaderboard but not the other?
An agent might write many low-commission policies (appearing on policy count leaderboard) but not earn enough commission to rank in the top five by earnings. Conversely, an agent might write few but very high-commission policies. The two leaderboards measure different aspects of performance.
Do rankings update in real-time?
Rankings reflect all data as of the last dashboard refresh. When new commissions post or new policies are issued, rankings automatically update the next time you view the dashboard or manually refresh the widget. There's no delay—data is always current.
Can I see rankings beyond the top five?
The widget displays only the top five performers to keep the visualization focused and motivating. For complete team rankings and detailed performance analysis, use the comprehensive reports available in the Reporting section, which can show all agents ranked by various metrics.
Why don't commission and policy rankings match?
Different agents excel in different areas. An agent specializing in commercial policies might write fewer but higher-commission policies, while another agent focusing on personal lines might write more policies at lower commissions per policy. Both contribute value to the agency in different ways.
Tips for Maximizing Team Performance
- Share Best Practices: Encourage top performers to mentor others and share their strategies
- Set Team Goals: Use leaderboards to track progress toward collective agency targets
- Create Friendly Contests: Run monthly competitions with prizes for top rankings
- Analyze Trends: Compare this month to last month to identify improving agents
- Balance Focus: Ensure agents understand that customer service and retention matter as much as sales volume
- Regular Recognition: Feature top performers in team meetings, emails, or agency newsletters
- Provide Support: Don't just track rankings—actively help agents improve their positions